Graphical Report: Track Your Progress with Virtual Pad
Welcome to Virtual Pad, the cutting-edge e-learning software that revolutionizes the way students learn and grow. As part of our commitment to providing an immersive and interactive learning experience, we are excited to introduce our powerful feature: the Graphical Report. With this innovative tool, students of all ages and levels can gain valuable insights into their academic progress, enabling them to take control of their learning journey like never before.
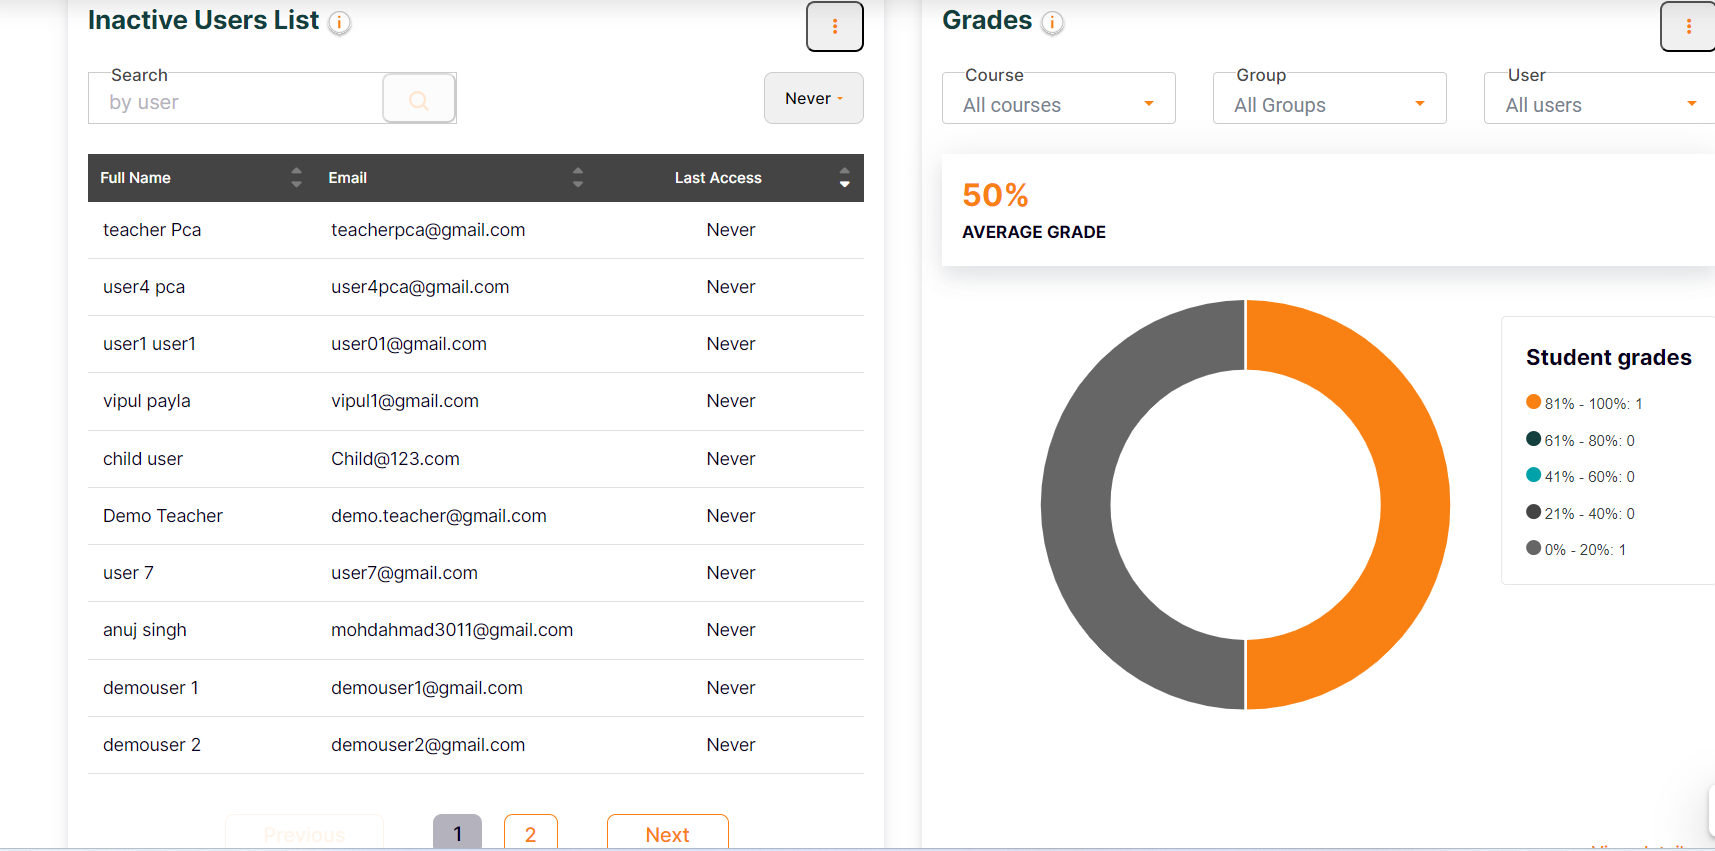
At Virtual Pad, we understand the importance of staying informed about your educational performance. That's why our Graphical Report is designed to provide a clear state of where you stand in every quarter. This feature offers a visual representation of your academic achievements, helping you to track your progress and identify areas where you can improve. With the Graphical Report, you can easily gauge your strengths and weaknesses, empowering you to set realistic goals and work towards achieving them.
The benefits of the Graphical Report extend beyond just tracking your performance. This feature provides comprehensive information about your grades, test scores, and assignment submissions. You can explore detailed breakdowns of your performance in specific subjects, allowing you to identify patterns and trends. With this data at your fingertips, you can gain valuable insights into your learning habits and make informed decisions about your study strategies.
Our Graphical Report is designed to be user-friendly and accessible to students of all ages. With its intuitive interface, you can navigate through the report effortlessly. Visual representations such as charts, graphs, and progress bars make it easy to interpret your data at a glance. Whether you're a young learner or a college student, you'll find our Graphical Report to be a valuable tool for self-assessment and growth.
Virtual Pad believes that education should be a collaborative experience. With the Graphical Report, you can easily share your progress with teachers, parents, and mentors. This fosters open communication and allows for personalized guidance and support based on your unique needs. Together, we can work towards unlocking your full potential and ensuring your success.
In conclusion, the Graphical Report provided by Virtual Pad offers a comprehensive overview of your academic progress, empowering you to take control of your learning journey. With its user-friendly interface and valuable insights, this feature helps you track your performance, identify areas for improvement, and make informed decisions about your education. Experience the power of the Graphical Report today and embark on a transformative learning experience with Virtual Pad.